

Perhaps I live too far from Cape Town, I have not yet received a sense of panic let alone urgency in their dire predicament. While reports vary as to the level of the dams, most do state that the remaining water will be consumed within two months.
Without being definitive, this blog will only touch on some eclectic issues.
Main picture: Voelvlei Dam
How did they get into this situation?
Beyond the severity of the worst drought in 100 years, a complex interplay of factors contributed to a crisis that could have been averted. According to environmental and geographical scientist, Dr Kevin Winter, it was created by a “perfect storm”.

Image: A slide from Dr Winter’s address at the Water Indaba.
Firstly it is acknowledged that the required infrastructure that they require right now is simply not here, and will not be in the near future. Even at a basic level such as water tankers, the most inefficient but quickest solution, the Western Cape simply did not have the water tankers required to supply residents in a pinch.
Aiding and abetting the provinces and national authorities myopia was a structural problem. Winter stresses that budget for long-term infrastructural improvements does not come easily. The years 2012 – 2014 delivered good rainfall, and as he puts it, it’s “really difficult” to justify billions in additional expenditure outside of crisis times. “It’s really hard to convince people of the need for a climate-proof city when things are working really well. Hence the focus was only on demand management. Other projects, which were more capital intensive, were waiting until the Western Cape Development Plan came on board – the first one (being) the augmentation of the Voelvlei Dam.”

Theewaterkloof Dam
On a similar note, Winter believes interventions have been at least partially hamstrung by party politics and structural obstacles between local and national government. In his opinion, the City’s drought interventions thus far have averted a far bigger crisis, but a combination of politicking and slow-grinding administrative wheels have also contributed to there being a crisis at all.
What does the rainfall trend reflect?
My brother, who is a resident of Cape Town, has supplied the following figures.
The rainfall figures for Cape Town over the last 12 months are a total and absolute anomaly.

Rainfall figures for Cape Town
All these stats apply to Cape Town Airport:
From Oct 2016 to Apr 2017 (7 mths) we only received 19.5mm of rain.
Rain Events (>0.5mm) occurred 27 Sept, 22 Oct, 22 Nov, 23 Dec, 23 Jan. All of these events were less than 5mm.
There was zero rain 29 Jan to 31 Mar.
From 1945 to 1996, the lowest rainfall recorded was 321mm and only 4 totals were below 400mm. The long term average is 542mm and we have just recorded 165mm!!!!!
These were taken from:
http://www.weatheronline.co.uk/weather/maps/city
http://www.1stweather.com/regional/data/data_daily_rain.shtml
Aquifers & ground water
The most obvious short term expedient is the use of the extensive aquifers especially those under Table Mountain. None of the reports that I have read, list project progress reports let alone whether the project has commenced. Even a relatively basic project such as this could take a year to implement so if the dams will only provide sufficient water for two months, this leaves a huge gap to be covered.
The economics of desalination
With an arid hinterland and an ever increasing population, this is an ever diminishing resource unless water is imported from the Gariep River but that would be a long-term project. A more immediate solution would be desalination. Again I will plagarise my brother’s work without attribution.
There is a lot of talk of how much less energy it takes to desalinate water which is driving people who don’t investigate any further to clamour for its implementation.
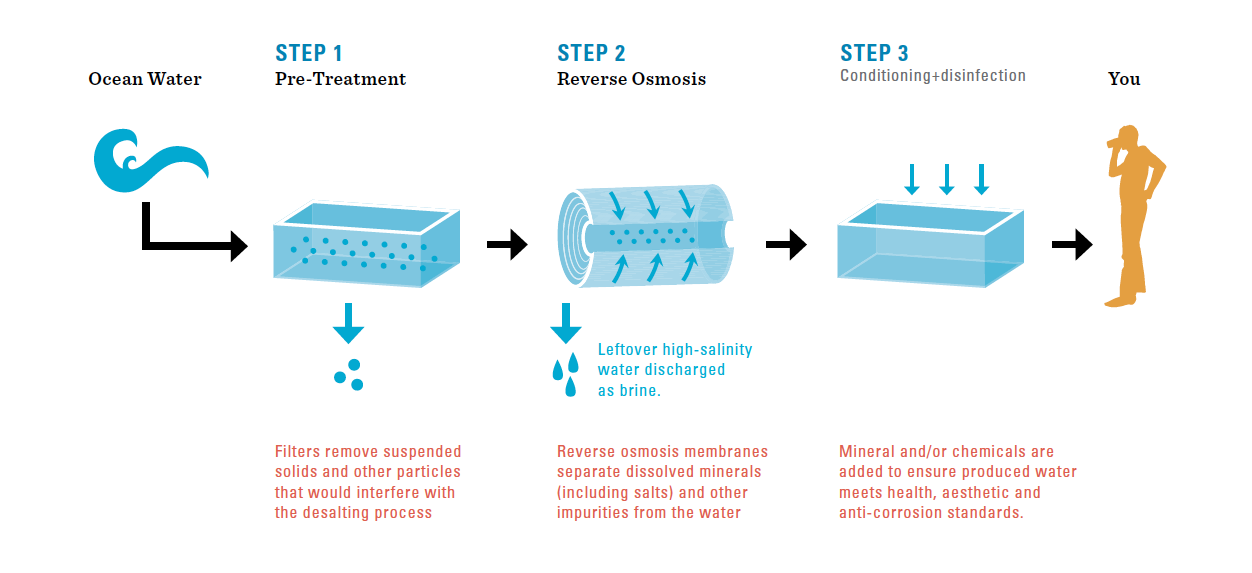
Operation of seawater desalination plants
Thermodynamically, the energy required to desalinate a m^3 is approx. 1kWh. Practically we seem to be able to achieve around 3.5kWh. The latest renewable energy systems seem to be able to deliver electricity at around 60 to 70 c/kWh. So it looks as if R2.50/klt is doable and a very acceptable price.
However, that is not the problem. The problem is the repayment of the capital costs.
At 10%, the repayment over 20years is R9650pm for every R1,000,000 borrowed, or R320 pd per R1mill.

Seawater desalination plants
Example 1: Australia
The Gold Coast Desalination Plant was designed to deliver 133Mlt pd and cost Aus$1.2bill in 2006. At R9.7.Aus$, the capital cost was R11,64bill. This requires a repayment of R3,725,000 pd.
This works out to R28 per klt.
Example 2: SA
The latest Richards Bay desalination plant has been reported to cost R300mill and capable of producing 10,000 klt/day.
The cost therefore works out to R9.60/klt.
The SA example is much better than the Aussie example but still shows that the energy cost is hardly the problem. (Even if I stretch the repayment period to 30years and interest to 5%, the numbers are still R15.7 and R5.37 per klt)
Then we still have to add operating costs and maintenance.

Voelvlei Dam
The example of the Gold Coast plant is salutary. They rushed off and implemented the solution in an emergency in 2006. Even given that the capital cost was already spent and all they had to worry about thereafter was the energy, maintenance and other operating costs, they declined to use this expensive source to the extent that between mid 2102 and mid 2015 they only made use of 5% of its capacity!
WTF
Naturally, there are other solutions which I have not mentioned such as hoping for a miracle or praying.
My solution to the residents of Cape Town is “Cheers”
Enjoy the beer when the taps run dry.
